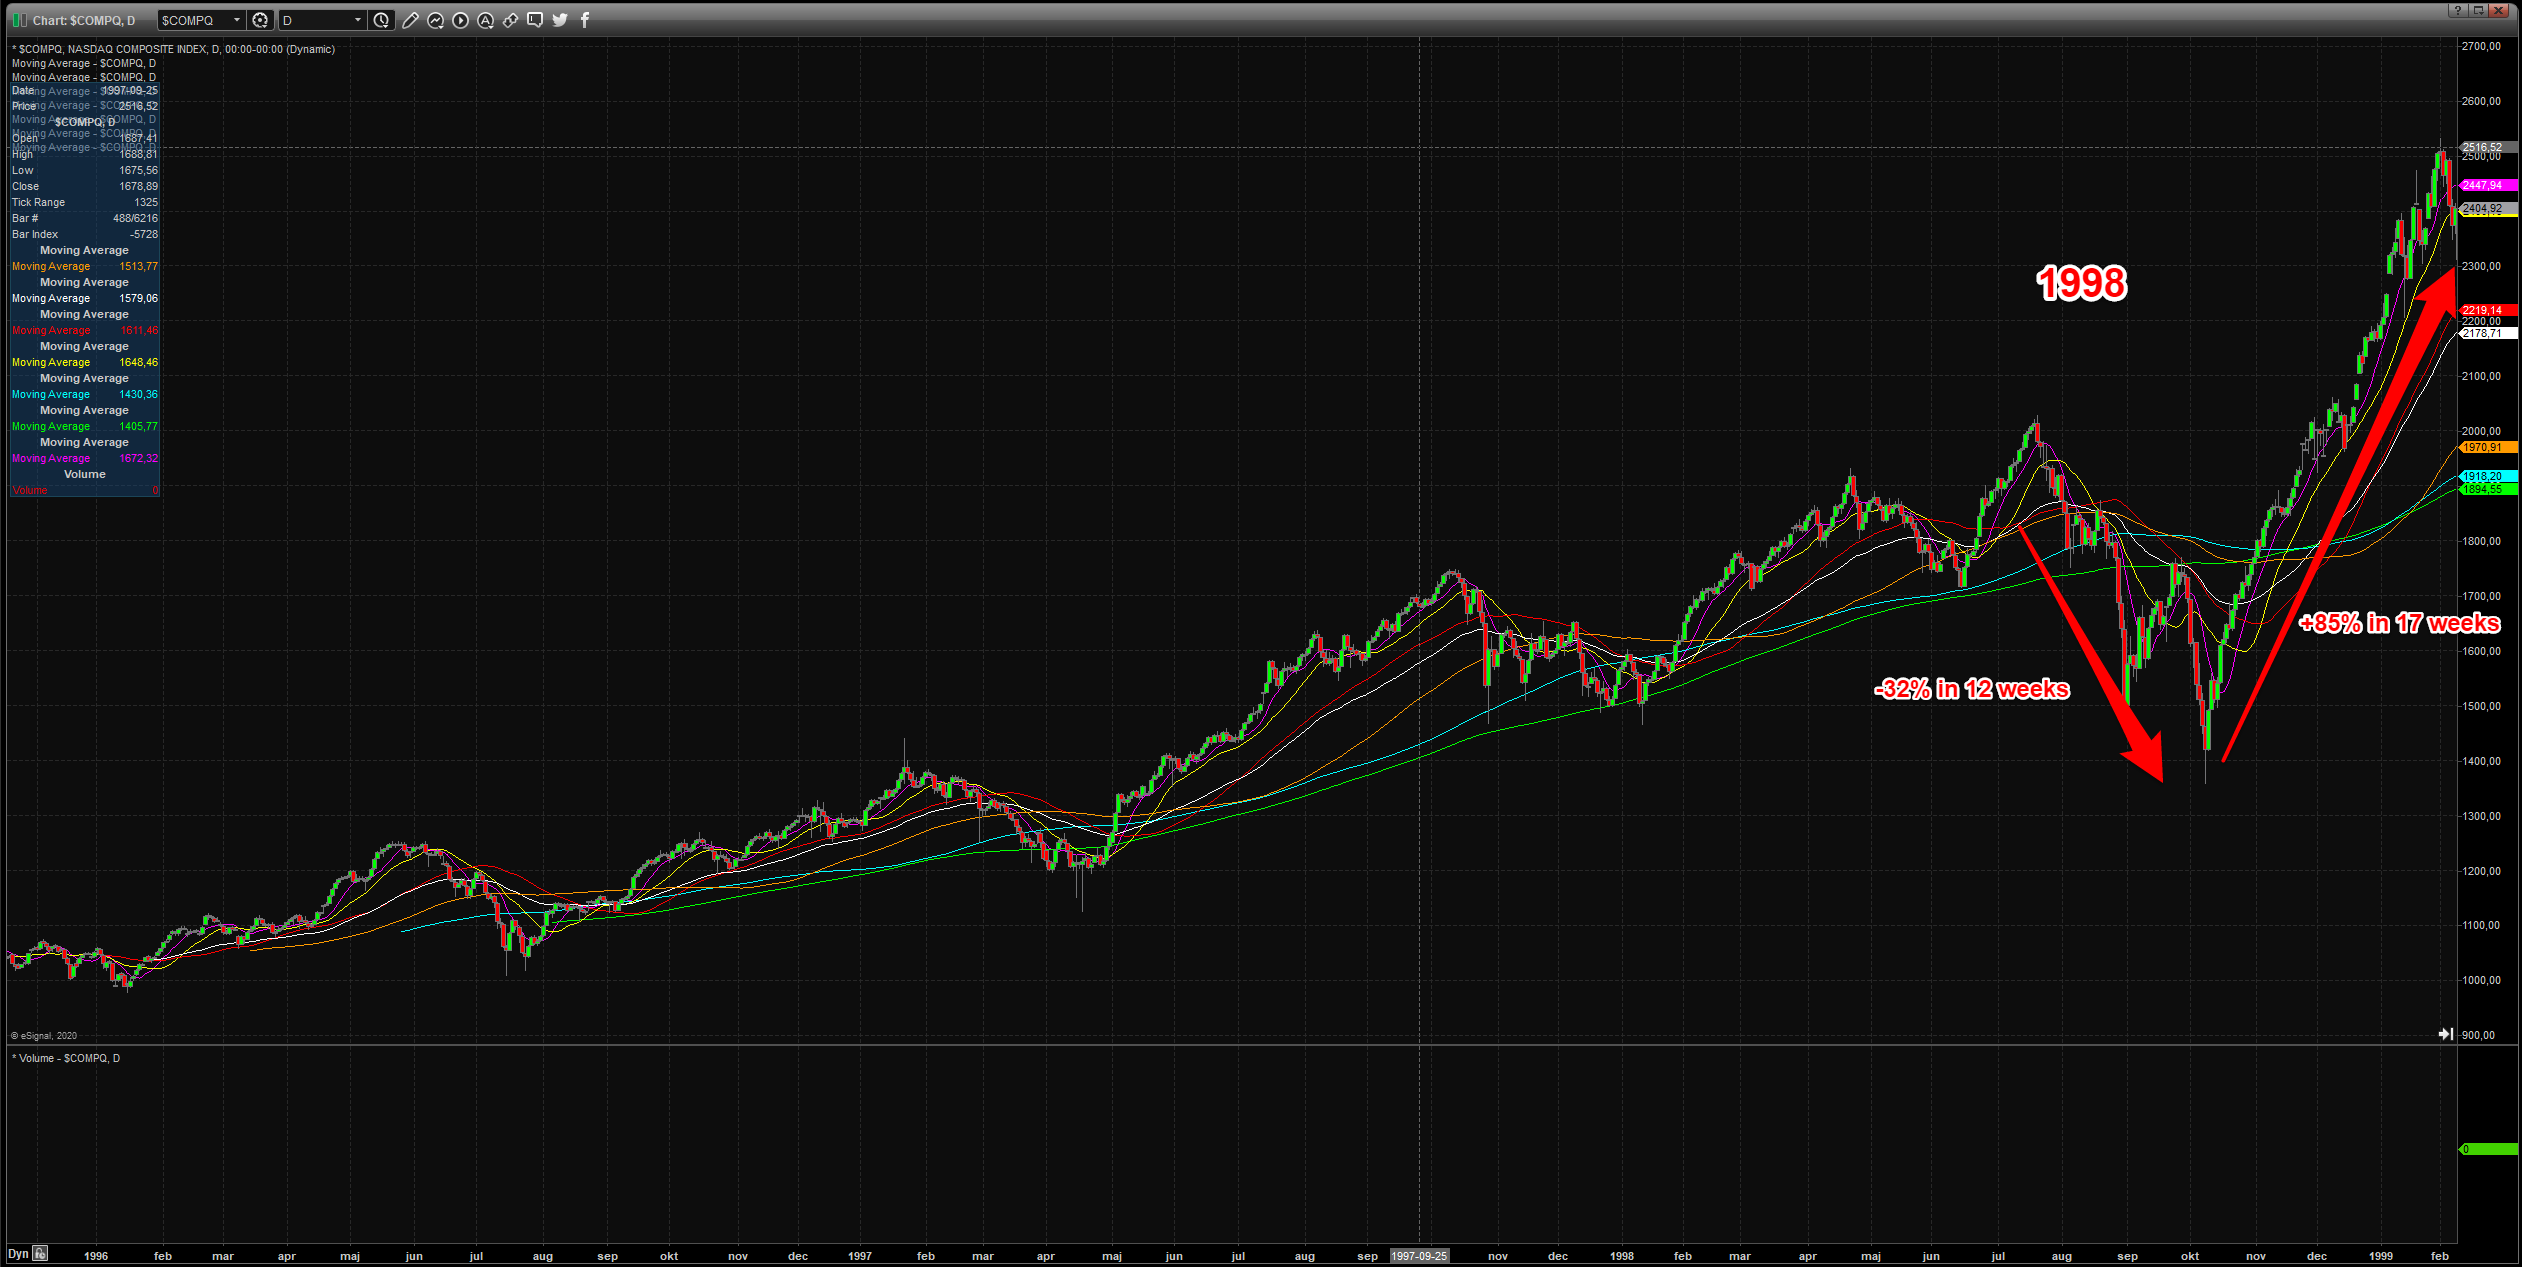
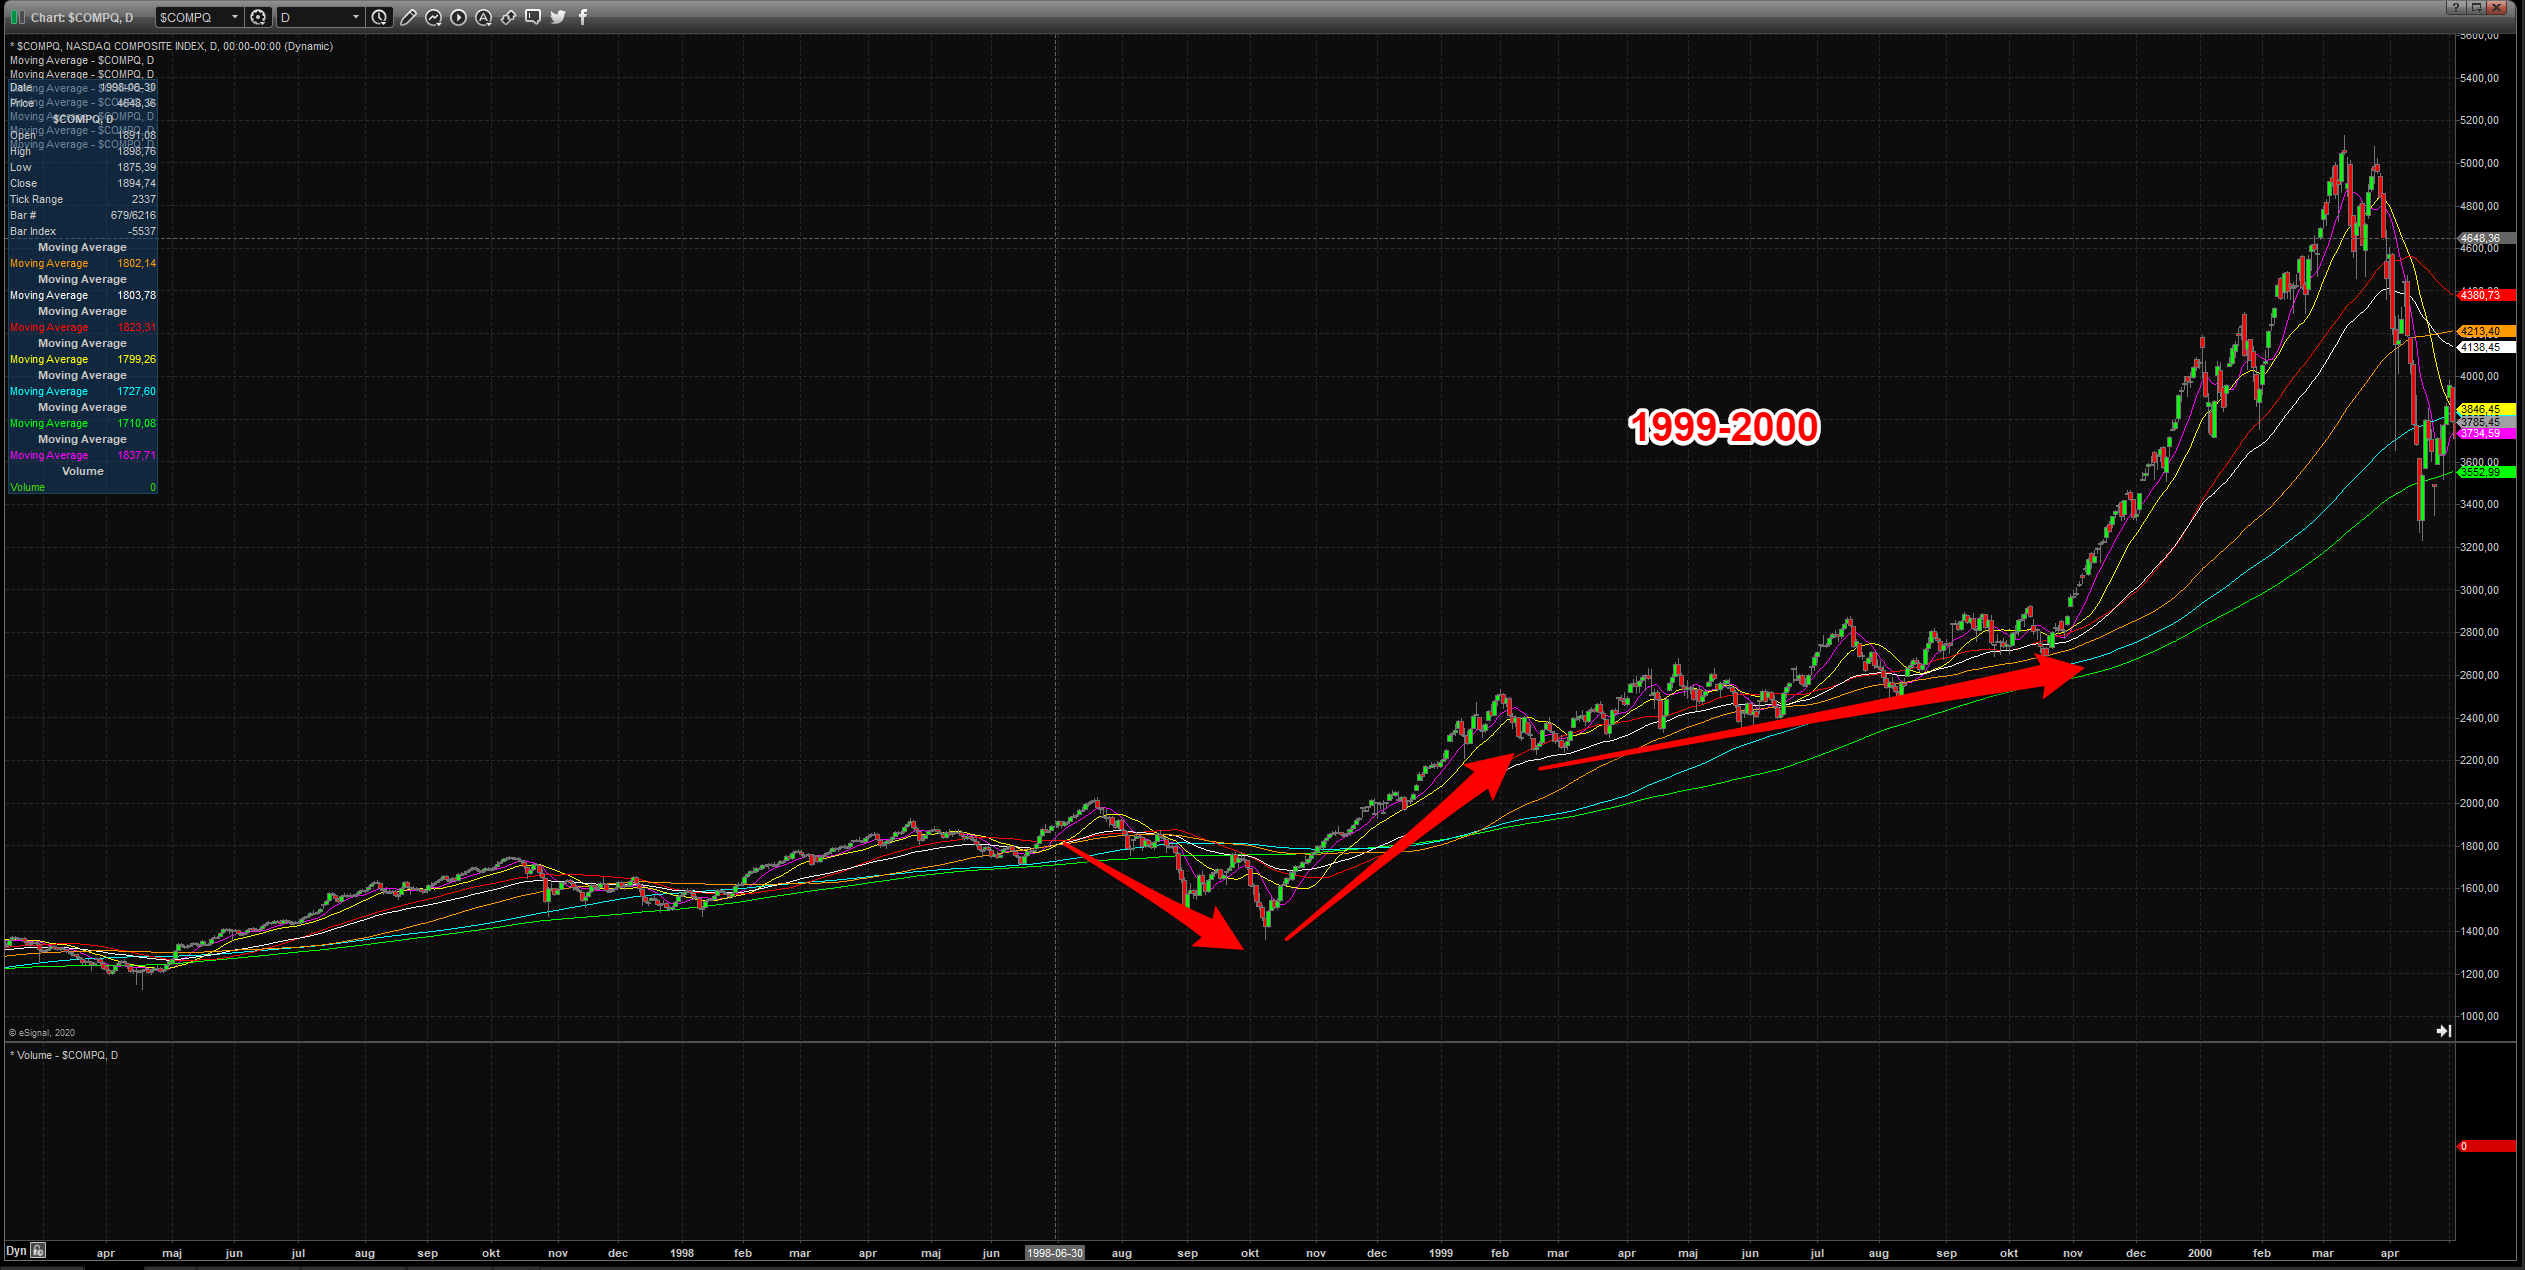
There are 3 instances in the past 25 years where the NASDAQ first crasched and then had a huge, relentless V-shaped recovery, up 40%+ in 3 months, surfing the 10/20 SMA for the whole move.
1998
2009
2020
Since the 2009 instance was after a multi-year bear market I will not include that one.
The 1998 and 2020 scenarios are very comparable since both occured after 10 years of a secular bull market.
Let’s look at the charts. Again, 1998 and 2020 look very similar in both duration and magnitude of both the down and up moves.


What am I trying to say here?
Since n=1 we don’t have much data to go on but the main thing to take away from this is the market doesn’t HAVE to crasch or even have a significant pullback just because “we are up too much too fast” or “it all doesn’t make sense” or “look at the macro” or this or that. We’ve been hearing those same arguments for 10 years now.
The pullbacks could be limited to 5-8% for a long time. Look at 1999 and how well the NASDAQ digested every pullback and found support on the rising moving averages.
I’m not saying things are going to play out exactly like this and I definitely don’t think we are going to have a parabolic like we had late 1999 to early 2000.
Now obviously we could have a second crasch around the corner, that’s why we always use the 10/20 SMA as our guide on the leading momentum stocks as I repeat daily on the stream.
It always pays to study historical moves in the markets instead to be clueless and let your emotions, biases, fear or anger guide you.
I see some people on Twitter, a few with huge following that are angry, frustrated and bitter that the markets keep going higher.
Good luck!
Dave
Thanks for all the great work Kris – couple of questions (have read this page a few times).
I know the important thing is the philosophy and not the specifics but still wanted to hear any thoughts on clarifying a couple of points from your article:
You write:
“You should also probably have alerts set, and know how many shares you want to buy” – if you’re using a buy stop order for a breakout, at the time of the order you will not know what the low of the day is (or indeed the gap between your entry and the low) and hence the position size – how to size then?
“just look at the daily chart and enter when the stock is starting to break out” – any thoughts on the wisdom of using buy stop orders i.e. automating the process
“You should sell 1/3 to 1/2 of the position after 3-5 days, and then move the stop to break even. The rest of the position should be trailed with the 10- or the 20-day moving average. Depends on how fast the stock is. If a beginner stick to the 10-day. You wait for the first CLOSE below the 10- day” – if you’ve sold half of your position, your breakeven for the ENTIRE trade will be lower than the entry price – so in that sense the stop can be lowered below entry for it to be “breakeven” – is this is what is meant….Also, when does one move from a breakeven stop to trailing to the 10 or 20DMA?
Thanks very much..
Kristjan Kullamägi
1) Then don’t use a buy stop order. I never do
2) Do whatever works for you
3) No idea what you are talking about. Clarify
Dave
Thanks – btw I was meant to post in “3 Timeless Setups” but accidentally posted in this article it appears.
On 3) let me try to clarify: say you bought 100 stocks at $100 (cost $10,000), and sold 50 stocks for $105 5 days later:$5250, so overall the the initial trade is at $250 profit.
My understanding is that with the remaining 50 stocks, you want to ride the larger move; so, the question was: for the remaining 50 stocks that you have not sold, is your stop set at $100 for that tranche (breakeven on the initial 100 stock trade) OR lower e.g. $97.5 because your profitable disposal of 50 stocks allows you to set the stop lower for the second tranche you want to hold for a longer term OR 10/20 DMA OR maybe the answer is “it depends”.
Thank you sir.
Henry
was browsing here as I often do…
Re your last inquiry, for me it’s partly a preference, I always lean on raising stop to break even as soon as possible, the more subjective part here is if you raised to break even too quickly and choked the trade (yet- can always get back in).
Casmyr
again , he doesn’t know what the fuck you’re really saying bro… you can put your stop loss wherever you want tbh and theres numerous ways to go about it, for example trailing stops or below specific levels/ moving averages etc. in which you identify would be advantageous to place your stop loss @.
sorry for coming off abrupt lol but this is exactly what he means by don’t ask stupid shit or I won’t respond.. Good day !
Other than that , I just wanted to say Im appreciative of your willingness to help everyone by showing them the edge that is manifested in reviewing older data to identify present day and repeating occurrences.
Much love from USA
Steve
> I definitely don’t think we are going to have a parabolic like we had late 1999 to early 2000.
Lol aged like milk